A process analysis is the examination of a workflow and the subsequent presentation. Depending on the intended use and objective of the study, the workflow or process is described using the following methods:
Conducting and documenting time studies
Here, the actual state is described in chronological order in terms of content and time. The aim is to determine target specifications and to make weak points in the process visible and quantifiable. For this we use the process analysis. In the process analysis, the process segments of the time studies are calculated or evaluated without reference to a unit, regarding their share in the total recording time and their value added in the process. While the proportion is to be clearly defined mathematically, the allocation to the criteria main process, secondary process (partly value-adding) or not value-adding is regarded to as a “flowing transition”.
First, the following definition applies:
Main process: Activities that are directly related to the performance of the work task. As a rule, these activities offer little potential for improvement.
Secondary process (partly value-adding):Activities that indirectly belong to the fulfilment of the work task and are variable in their expenditure. These activities offer improvement methods that can be realized through varying degrees of effort.
Non-value-added activities: Activities that do not directly belong to the work task and usually cause additional work. These activities have the greatest potential for improvement, often through organisational changes or small investments.
The figure shows a typical process structure which we often find in different industries.
It can clearly be seen that over 30% of the activities are not value-adding. At this point, we, together with your team, are going to enter the improvement process. Optimizations can be achieved in part by quick organizational measures, others may require technical changes and investments.
In any case: We accompany you throughout the improvement process, until its sustainable implementation.
Presentation of the material flow
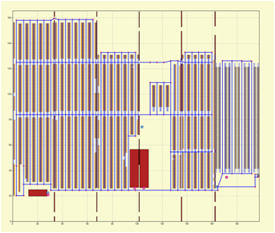
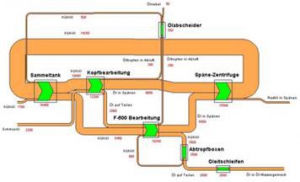
The material flow is usually presented in a graph, where the goods movement of the production system or the warehouse with the corresponding quantity volumes, is being systematically presented. The aim is to reduce unnecessary distances and travel times, or the transport volume. Depending on the requirements, we create, for example, a Sankey diagram in cooperation with our clients
or use PROCESS MX (our software for mapping path matrices) to make the material flow transparent and calculable.
Working with critical path analysis
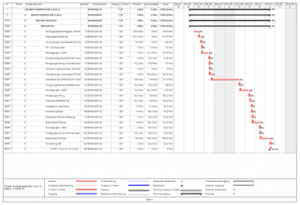
The critical path analysis is an ideal way to display highly complex processes which are related technically as well as temporally. To do so, we are using the high-performance project management software from Microsoft: MS Project. Used intelligently, one can, for example, import structural parts lists and work schedules in addition to project control, in order to calculate the lead times of very complex components and visualize the critical path.
The process and sequence analysis are good means of illustration and finally provide a simple overview of potential savings.
Please do not hesitate to contact us for more information about process analysis!


